Always measuring
Latency, jitter and loss to your gateway and the internet, DNS lookups, live throughput and a 0–100 health score.
ISAP Labs · Helios is in development
We are a software development company building practical tools with obsessive attention to how they feel to use. Our first product is Helios: a network monitor that keeps watch over your internet, router, switches, Wi-Fi and devices, and tells you the moment something breaks.
Feature overview · real app, demo network
01 · Product
Turn a spare laptop or mini PC into a full-screen network health display. One status, one glance. Try the live replica below: switch the network state and watch it react.
Internet, router and DNS are all answering.
Sample numbers. After two minutes without mouse movement, the real dashboard fades into this Glance view, and drifts a few pixels a minute to protect the screen from burn-in.
Latency, jitter and loss to your gateway and the internet, DNS lookups, live throughput and a 0–100 health score.
A year of history in a local SQLite database, an ISP outage log with a monthly PDF report for your provider, and a weekly summary.
When a problem starts, the screen flashes, a sound plays and a pop-up says what went wrong. Short blips are counted, not shouted about.
02 · Tour
Straight from the tech demo. Scroll through the views.
A health score, latency, jitter and loss, DNS, live WAN throughput and 24 hours of history for every check. Security from your firewall, AdGuard or Pi-hole, Suricata and Zenarmor sits beside it.

Its connection, identity, maker and its own 24-hour history. Tell Helios what it is, which switch it hangs off, or ask to be alerted the moment it goes offline.

The router at the centre, switches and access points as hubs, devices in orbit. Colour is state, so a problem glows before you read a word.

Internet, modem, router, switches, devices: your network as a model you can walk around. Drag to turn it, scroll to zoom.

03 · Topology
Helios draws your network as a tree: internet, router, switches, access points, devices. Point at anything and its route lights up, box by box. Overlay traffic, latency or security, trace the way out hop by hop, or step back through the last 24 hours. Hover a device below.Tap a device below.
04 · Resilience
A monitor that fails along with your network is no use. Pick a failure and see what Helios does, step by step.

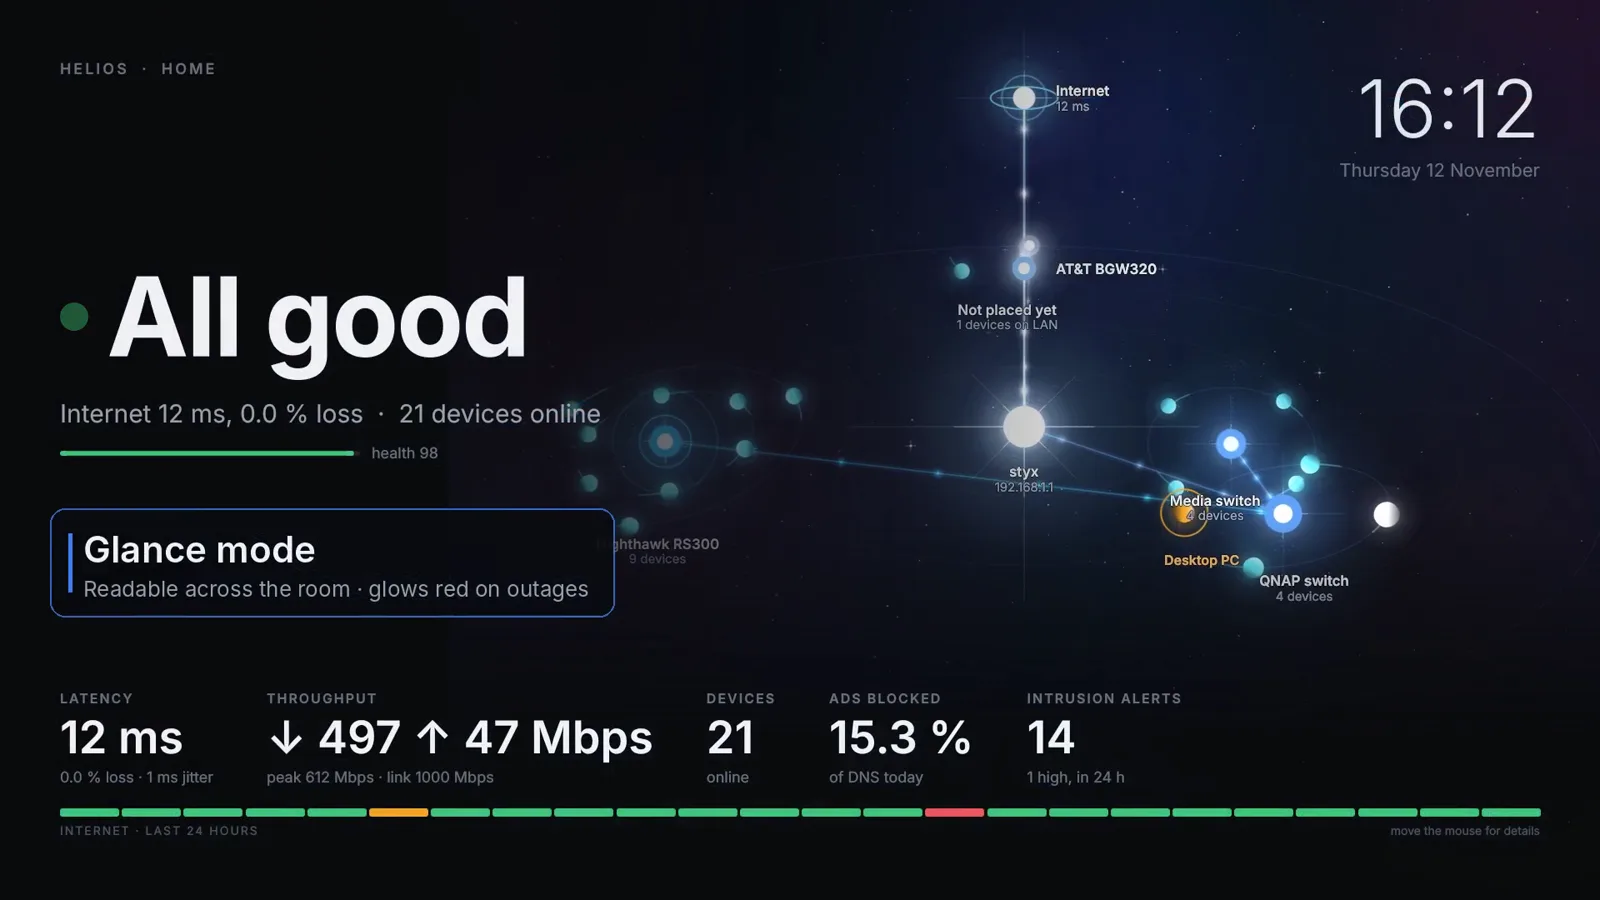
Glance mode from the tech demo. Drag to compare. When the internet drops, the whole room knows.
05 · Integrations
Every integration is optional and read-only. Credentials stay in a config file on your machine that only you can read. Each one is marked Confirmed (checked against the real product) or Experimental (checked in our test lab, waiting on real hardware).
ExperimentalUniFi & Omada Wi-Fi and switches pfSense OpenWrt MikroTik routers SNMP managed switches Synology, QNAP, TrueNAS NAS health
/metrics endpoint for Grafana06 · Pricing
Helios itself is free for personal and other noncommercial use, and its source is public to read. Helios Mobile is a small yearly subscription that funds development and lets you check on your network from anywhere.
Helios for Linux desktops & Docker
In development$0free for personal, noncommercial use
Helios Mobile for iOS & Android
$8per year · about 67¢ a month

07 · Install
In developmentInstall opens with the public release.
On a desktop, Helios installs as a Debian package and starts two services that restart themselves if they stop: one for checks and alerts, one for the screen. A setup wizard walks you through the rest. No screen? The Docker image runs the checks, alerts, history and phone dashboard on amd64, arm64 and armv7. Here is a preview.
08 · Roadmap
Helios is in development and isn’t public yet. Email us and we’ll tell you the moment it’s released.